Impact
at Home

The automotive ecosystem (including direct, indirect and induced value added) drives more than $1.2 trillion into the U.S. economy each year - 4.8 percent of GDP.

Economic Impact
U.S. Auto Industry A Trillion Dollar Economic Impact
If the U.S. Auto Industry were a country, its economic contribution would rank #17 on the list of largest countries by GDP.
- 115.2 million new vehicles sold in 2023
-
- 2Total New Vehicle Sales 2023: $643 billion
-
- 3$1 in manufacturing = $4.23 economic value
-
Top 10 States where autos contribute the most to GDP
Top 10 States
% State GDP- 1Michigan 9.2%
- 2Kentucky 6.4%
- 3Tennessee 6.0%
- 4Indiana 5.7%
- 5Alabama 5.4%
- 6South Carolina 4.9%
- 7Missouri 4.9%
- 8Delaware 4.7%
- 9Mississippi 4.6%
- 10Arizona 4.1%
Jobs Report
10.1 Million Jobs Coast to Coast

Across the United States, the auto industry is a major employer, supporting jobs not only in auto manufacturing, but also through an extensive network of parts, components and material suppliers, and a vast retail and maintenance network of dealers and aftermarket products and services.

4.9% of U.S. employment and $732B in annual payroll.
Nearly one in 20 jobs across the country is supported by the Auto Industry.
Auto Industry Employment
- 1California 841,986
- 2Texas 726,196
- 3Florida 513,287
- 4Michigan 409,220
- 5Ohio 309,910
- 6Illinois 279,745
- 7Georgia 260,883
- 8New York 247,559
- 9Pennsylvania 238,315
- 10Tennessee 225,289

In 25 states, more than 100,000 jobs are supported by the auto industry.
Tax Report
Outsized Contribution to Federal, State and Local Tax Receipts
Auto industry activity - from parts suppliers, to worker paychecks, to vehicle sales, to income for small businesses - is a major driver of government tax receipts/revenue.

Registrations + Sales
Consumers have choices
New vehicle sales of internal combustion engines remain popular; Electrification increasing across all segments; EV availability growing.
15.2 Million Vehicles Sold in 2023
Automobile manufacturers continue to give the consumers options to fit a wide variety of needs and demand for new vehicles remains strong.
Light trucks had at least a 70 percent market share in all 50 states and the District of Columbia.
State with the highest rate of:


80% of vehicles sold in the U.S. in 2023 were light trucks.
- 58% Utility Vehicles
- 18% Pickup
- 4% Van
- 20% Cars
- 58% Utility Vehicles
- 18% Pickup
- 4% Van
- 20% Cars
Electrification on the Rise
While internal combustion engine (ICE) vehicles still dominate, their share has steadily declined from 97% in 2016 to 80% in 2023. Meanwhile, hybrid, battery electric (BEV), and plug-in hybrid (PHEV) vehicles are gaining momentum:
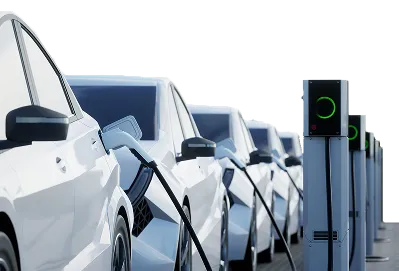
114 EV models available in 2023 across all body styles
More than 4.3 million EVs are now on U.S. roads, representing 1.5% of all light vehicles in operation

114 EV Models
114 models of EVs (including battery electric, plug-in hybrid, and fuel cell vehicles) were available to consumers in 2023 - in all body styles: sedans, utility vehicles, pickups, and vans.
Internal combustion engine (ICE) Vehicle Market Share Change, Year-over-Year
2016 - 2023For the most up to date information on the electric vehicle market, visit
Get ConnectedRegistered Light Duty Vehicles in Operation
- Internal Combusition Engines
- Electronic Vehicles
- EV% VIO
Electric Vehicle Supply Chains
The U.S. auto industry's leadership in global markets is increasingly dependent on its ability to transition to electric vehicles (EVs) and secure the supply chain for key components.
As global demand for EVs rises and regulations tighten, nations like China, which began investing in electrification 15 years ago, dominate crucial areas of the EV supply chain, such as the mining and processing of critical minerals like lithium and cobalt. The U.S. is currently far behind, and its reliance on foreign sources, particularly China, exposes it to geopolitical risks and market vulnerabilities. However, by localizing and diversifying the EV supply chain (including working with allies and partners), the U.S. can regain competitiveness, stimulate economic growth, and enhance energy security.
Investments in the Supply Chain
Automakers and battery manufacturers have invested heavily in EVs, with much of their $125 billion commitment focused downstream - finished vehicles and battery cell production. Over 900 GWhs of battery cell production are expected to be added in the U.S. by 2030 (more than an 800% increase over current capacity).

