Cleaner.
Safer.
Smarter


Global automakers are investing over $1.2 trillion in EVs by 2030, advancing safety innovations, cutting emissions, and enhancing road safety through modern technology and infrastructure.

Driving Toward a Cleaner Future
An Electrified Future

On a global scale, automakers are planning to spend an estimated $1.2 trillion through 2030 to develop and build new battery-powered vehicles.
The EV Market
Midyear - 2024 UpdateAlmost 14 million new electric cars were registered globally in 2023, accounting for around 18 percent of all vehicles sold, an increase from 14 percent in 2022 and only 2 percent in 2018. Nearly 95 percent of all global EV sales were in China (60 percent), Europe (25 percent) and the United States (10 percent).
In the U.S., more than 730,000 EVs were sold in the first half of 2024, 9.7 percent of all light vehicle sales and an increased market share of nearly one percentage point over the first half of 2023.
Choice Matters
Automakers Continue to Produce New Offerings and There Were 117 Vehicle Models Sold in Q2 2024
- 20 Cars
- 38 Utility Vehicles
- 5 Pickups
- 5 Vans
- 17 Cars
- 29 Utility Vehicles
- 1 Van
- 1 Car
- 1 Utility Vehicle
- Quarterly EV Market Share
- Annual EV Market Share
Growing need for Public Charging
While home charging will remain critically important - with an estimated need for 26.7 million private home and workplace chargers - more than 1.2 million additional public chargers are needed by the end of 2030 to meet the needs of 50 percent EV market share.
- Single Family Homes
- Multi-Unit Residential
- Workplace

- Single Family Homes
- Multi-Unit Residential
- Workplace
- Fleet
- Public

- Fleet
- Public
- Multi-Unit Residential

An assessment by the U.S. National Renewable Energy Laboratory (NREL) released in June 2023 estimated that a network of 28 million charging ports would be necessary to support 50 percent EV sales y 2023 (and 33 million EVs on the road). NREL estimates that 96 percent of those charging ports would be privately accessible L1 and L2 chargers located at single-family homes, multifamily properties, and workplaces. The remaining 4 percent (1,249,000 ports) would be split between public L2 and high-speed DC Fast charging ports, with L2 making up 85 percent of those public chargers.
The bipartisan Infrastructure Investment and Jobs Act (IIJA) that was signed into law in November 2021 includes $5 billion in funding for states to establish a nationwide EV charging network (NEVI) along highway corridors and $2.5 billion in competitive grants to deploy publicly available EV charging and other alternative fuel stations through 2026. NEVI provides funding to states to strategically deploy charging infrastructure and to establish an interconnected network of publicly available charging
Private, L2, and DC Fast Chargers Needed for 50% EV Sales by 2030 / 33 Million EVs
-
26,762,000
Private Chargers
(Homes/Workplaces) - 1,067,000 Public L2 Chargers
- 182,000 DC Fast
- Private Chargers (Homes/Workplaces)
- Public L2 Chargers
- DC Fast
1,249,000 Public Chargers Needed to Support 50% EV sales by 2030 / 33 Million EVs
-
177,386
Chargers Installed
(as of end of Q2 2024) - 1,071,614 Chargers Needed
- Chargers Installed (as of End of 2024)
- Chargers Needed
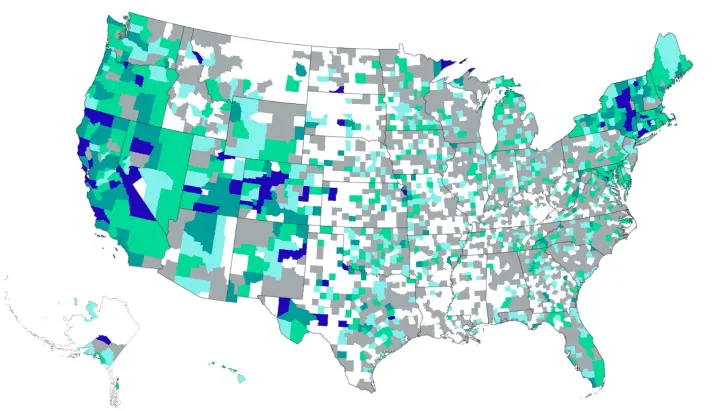
EV Charging Ports Per 10,000 Vehicles in Operation, by County
There are 3,145 countries and independent districts in the United States with more than 287 million light-duty vehicles - 5.1 million of which are electric.
- Less than 1
- 1-3
- 4-5
- 6-9
- 10-20
- 21+
Source: Figures compiled by Alliance for Automotive Innovation with vehicle in operation data provided by S&P Global Mobility through June 30, 2024, Housing and Urban Development, Office of Policy Development and Research Crosswalk data, and U.S. Department of Energy, Alternative Fuels Data Center charging station data.
The current map of publicly available charging shows an urgent need to focus on charging infrastructure.
50 percent (1574 counties) had five or fewer publicly available charging ports installed as of June 2024;
29 percent (906 counties) had zero public ports;
Nearly half the country (48 percent of counties) lacked access to a public DC Fast charger;
More than one-quarter of all DC Fast charging ports are located in California.
Where are the EVs?

Electric Vehicles Per 10,000 Residents
and
Median Household Income.

U.S. Fleet Continues to Make Fuel Efficiency Gains
Automakers have reduced CO2 emissions rates for new vehicles by almost 30% (28.4%) since 2005 - about two years ahead by the U.S. Paris Agreement (which seeks to achieve a 26-28% overall reduction in GHG missions by 2025). And real-world fuel economy has uncreased 30% over the same period.
Building a Safer Future
Building a Safer Future Shared Responsibility or Vehicle and Road Safety

The road ahead is safer, thanks to a wide range of state-of-the-art technologies developed by automakers, and suppliers. But safety goes beyond the vehicle - its a joint responsibility for all road users to practice safe habits.
Progress... But Work Remains
/ VMT (100,000,000) Fatality Rate
Per 100M VMT
- Total Fatalities
- Miles Traveled (100,000,000)
- Fatality Rate
An estimated 40,990 people died in motor vehicle traffic crashes in 2023, a decrease of about 3.6 percent as compared to 42,514 fatalities reported during the previous year.
The estimated fatality rate for 2023 is 1.26 fatalities per 100 million VMT, down from the reported rate of 1.33 fatalities per 100 million VMT in 2022.
Ending Unsafe Driving Behavior Could Lower Fatalities
- Working to Prevent Impaired Driving
- Alcohol-Impaired Driving
- Safe System Approach
- Cambridge News & Insights
Does Vehicle Age Matter?
New vehicles being produced are undeniably safer than ever - a review of in-vehicle fatalities in 2022 show that the number of fatalities in newer vehicles is disproportionately lower than the number of those vehicles on the road.
Splitting the fleet in half by model year to obtain an even percent of vehicles in operation in both groups found*:
- Vehicles with a model year between 1991 and 2013 represented 48% of all vehicles on the road, but 62% of all in-vehicle fatalities.
- Vehicles with a model of 2014-2024 represented 49% of all vehicles on all road but accounted for 36% of all in-vehicle fatalities.
The average age of vehicles on the road is over 12.7 years - and growing!
Vehicles in Operation
In 2022, more than 90 percent of the vehicles on the road were model year 2000 or newer. The rate of fatalities per 10,000 vehicles in operation continues to steadily decline, decreasing to a rate of 0.69 for Model Year 2022.
Source: National Highway Traffic Safety Administration, Fatality and Injury Reporting System, 2022 data; vehicles in operation data figures compiled by Alliance for Automotive Innovation with registered vehicle data provided by S&P Global Mobility, 2022 data
Smarter Mobility
Smarter Mobility

Advanced Driver Assistance Systems (ADAS) Over 90% of new cars today are equipped with ADAS features such as pedestrian detection, blindspot alers, lane departure warnings, collision warnings and collision mitigation (automatic emergency braking). These safety features can greatly enhance safety. Studies have shown that automatic emergency braking, for example reduces front-to-rear crashes by 50%.
Rapid Growth in Installation Rates of ADAS Technology In less than 10 years, ADAS systems have grown from fledgling technologies to widespread deployment in new vehicles - including Automatic Emergency Braking being offered in nearly all new vehicles. See more about automakers commitment to AEB here.


ADAS Installations: 2018 - 2024 (Mid-Year)
- +87.3 pp
- +56.7 pp
- +74.6 pp
- +79.6 pp
- +85.8 pp
- 0%
- 10%
- 20%
- 30%
- 40%
- 50%
- 60%
- 70%
- 80%
- 90%
- 100%
- Active Pedestrian Detection
- Blindspot Alert
- Lane Departure Warning
- Collision Warning
- Total Collision Mitigation
- 2016
- 2017
- 2018
- 2019
- 2020
- 2021
- 2022
- 2023
- 2024 (mid-year)
Active Pedestrian Detection was installed in only 7% of new vehicles in 2016 - by mid-2024, 95% of new vehicles have the technology installed - an increase of 87% in just 7.5 years.
An IIHS study showed that automatic braking systems that recognize pedestrians cut pedestrian crashes by 27%.

Advanced Driver Assistance Systems
How do they work?While it takes many years for the vehicle fleet to turn over (there are more than 286 million vehicles on the road with an average age of over 12.7 years) and for new technologies to be prevalent on the road, ADAS technologies are expected to widely penetrate the fleet by 2027.
Three features (rear cameras, rear parking sensors and front crash prevention) are predicted to be on more than half of the registered vehicle population by 2027.
Rear cameras and rear parking sensors are predicted to be on 73 and 63% of the registered vehicle fleet by 2027, respectively.
Front automatic emergency break (AEB) is predicted to increase from 23% of the registered vehicle population in 2022 to 47% in 2027.